The Opening: How Does "On the Books, Missing on the Shelf" Happen?
A consumer-electronics warehouse with 50,000 locations ran two wall-to-wall counts a year — 40 people, 3 days each — yet inventory accuracy stalled at 96.5%. That remaining 3.5% meant cancelled orders every single day: "the system says it's in stock, the floor can't find it." Manual counting has a hard ceiling: people tire, misread, and can't see the top racks. Vision AI exists to automate and standardize the act of "looking."
The Core Framework: Four Points
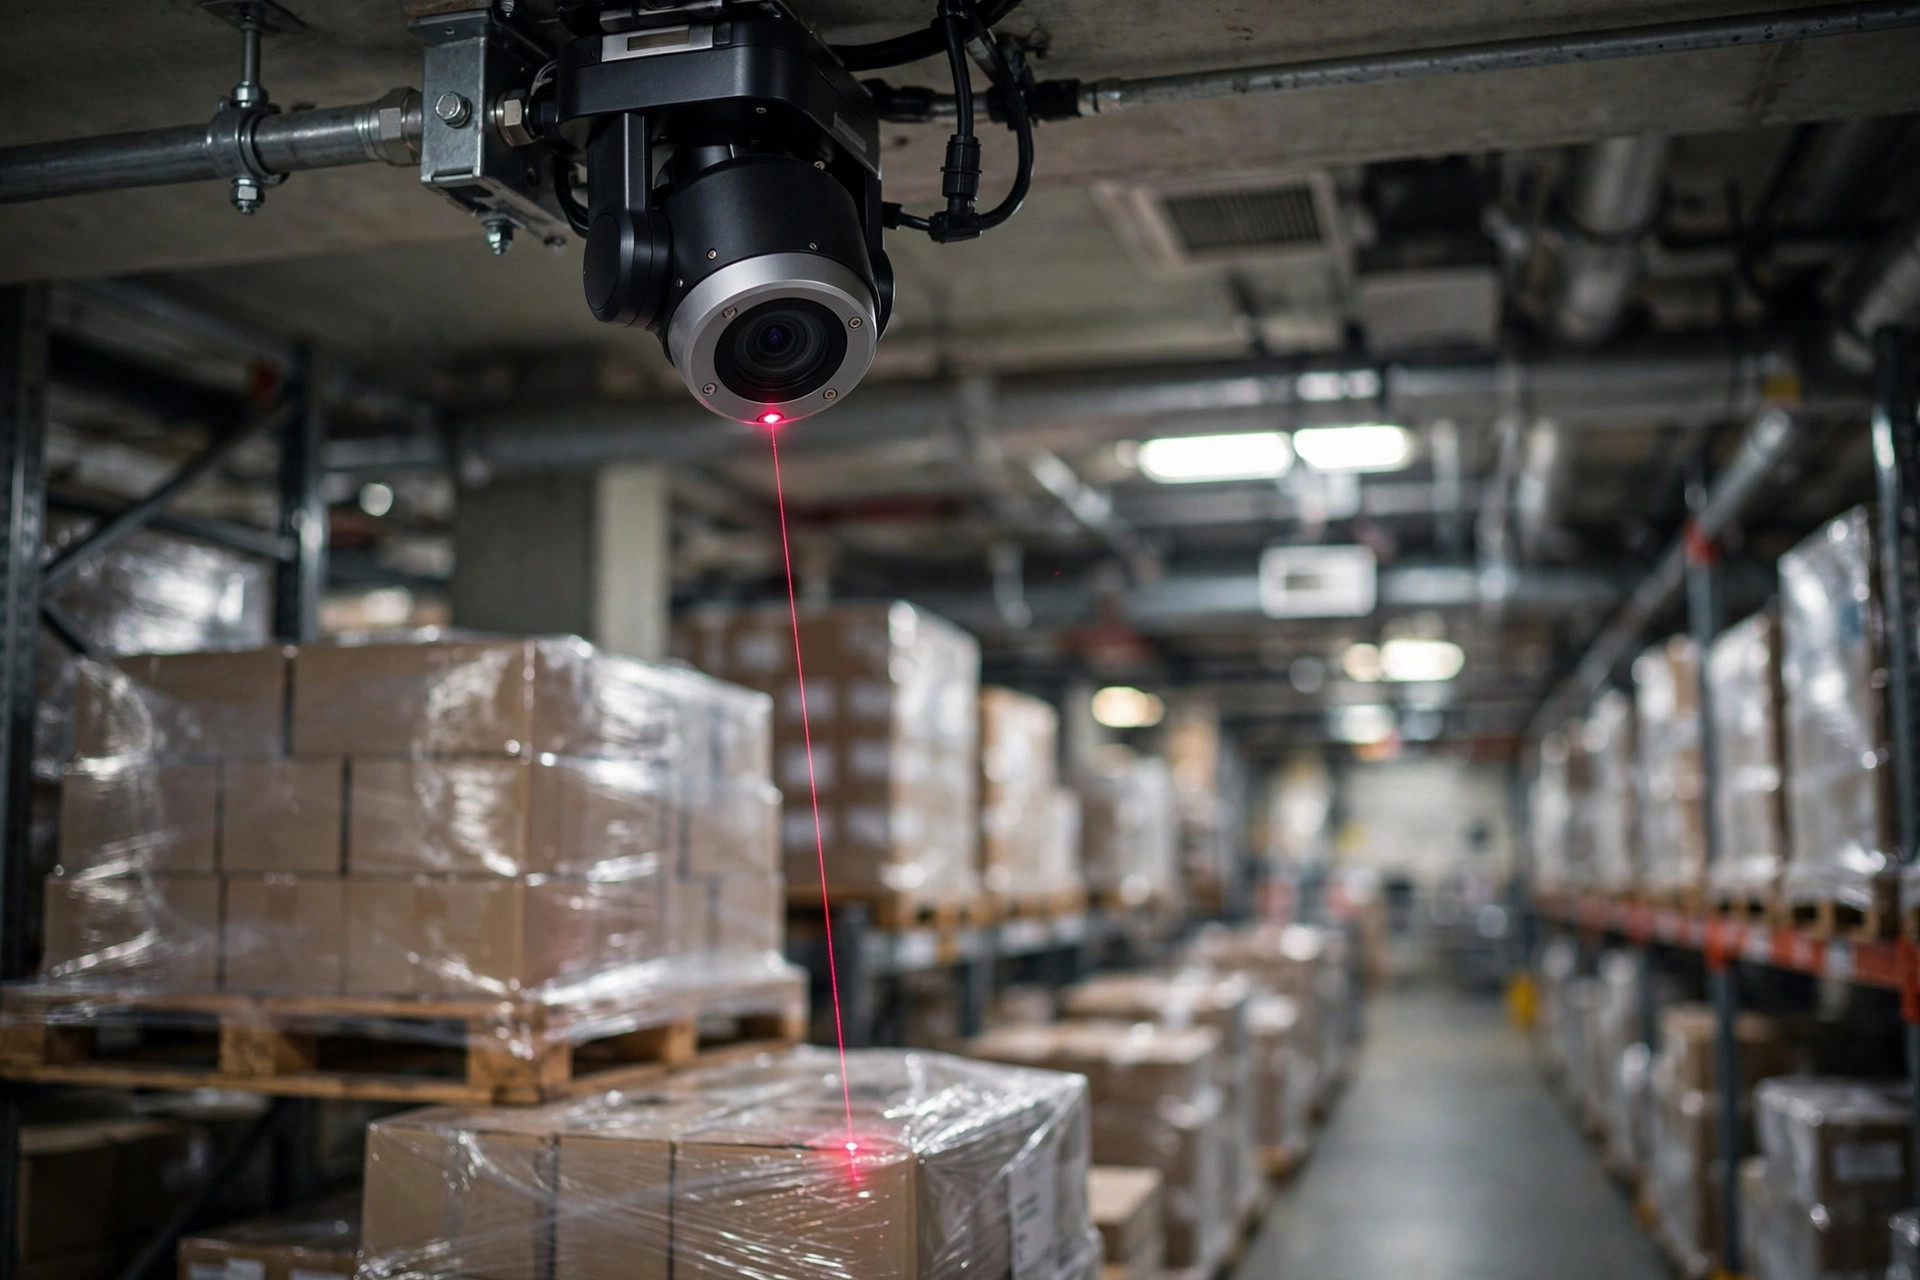
1. Location Audits: Let Cameras Walk the Aisles
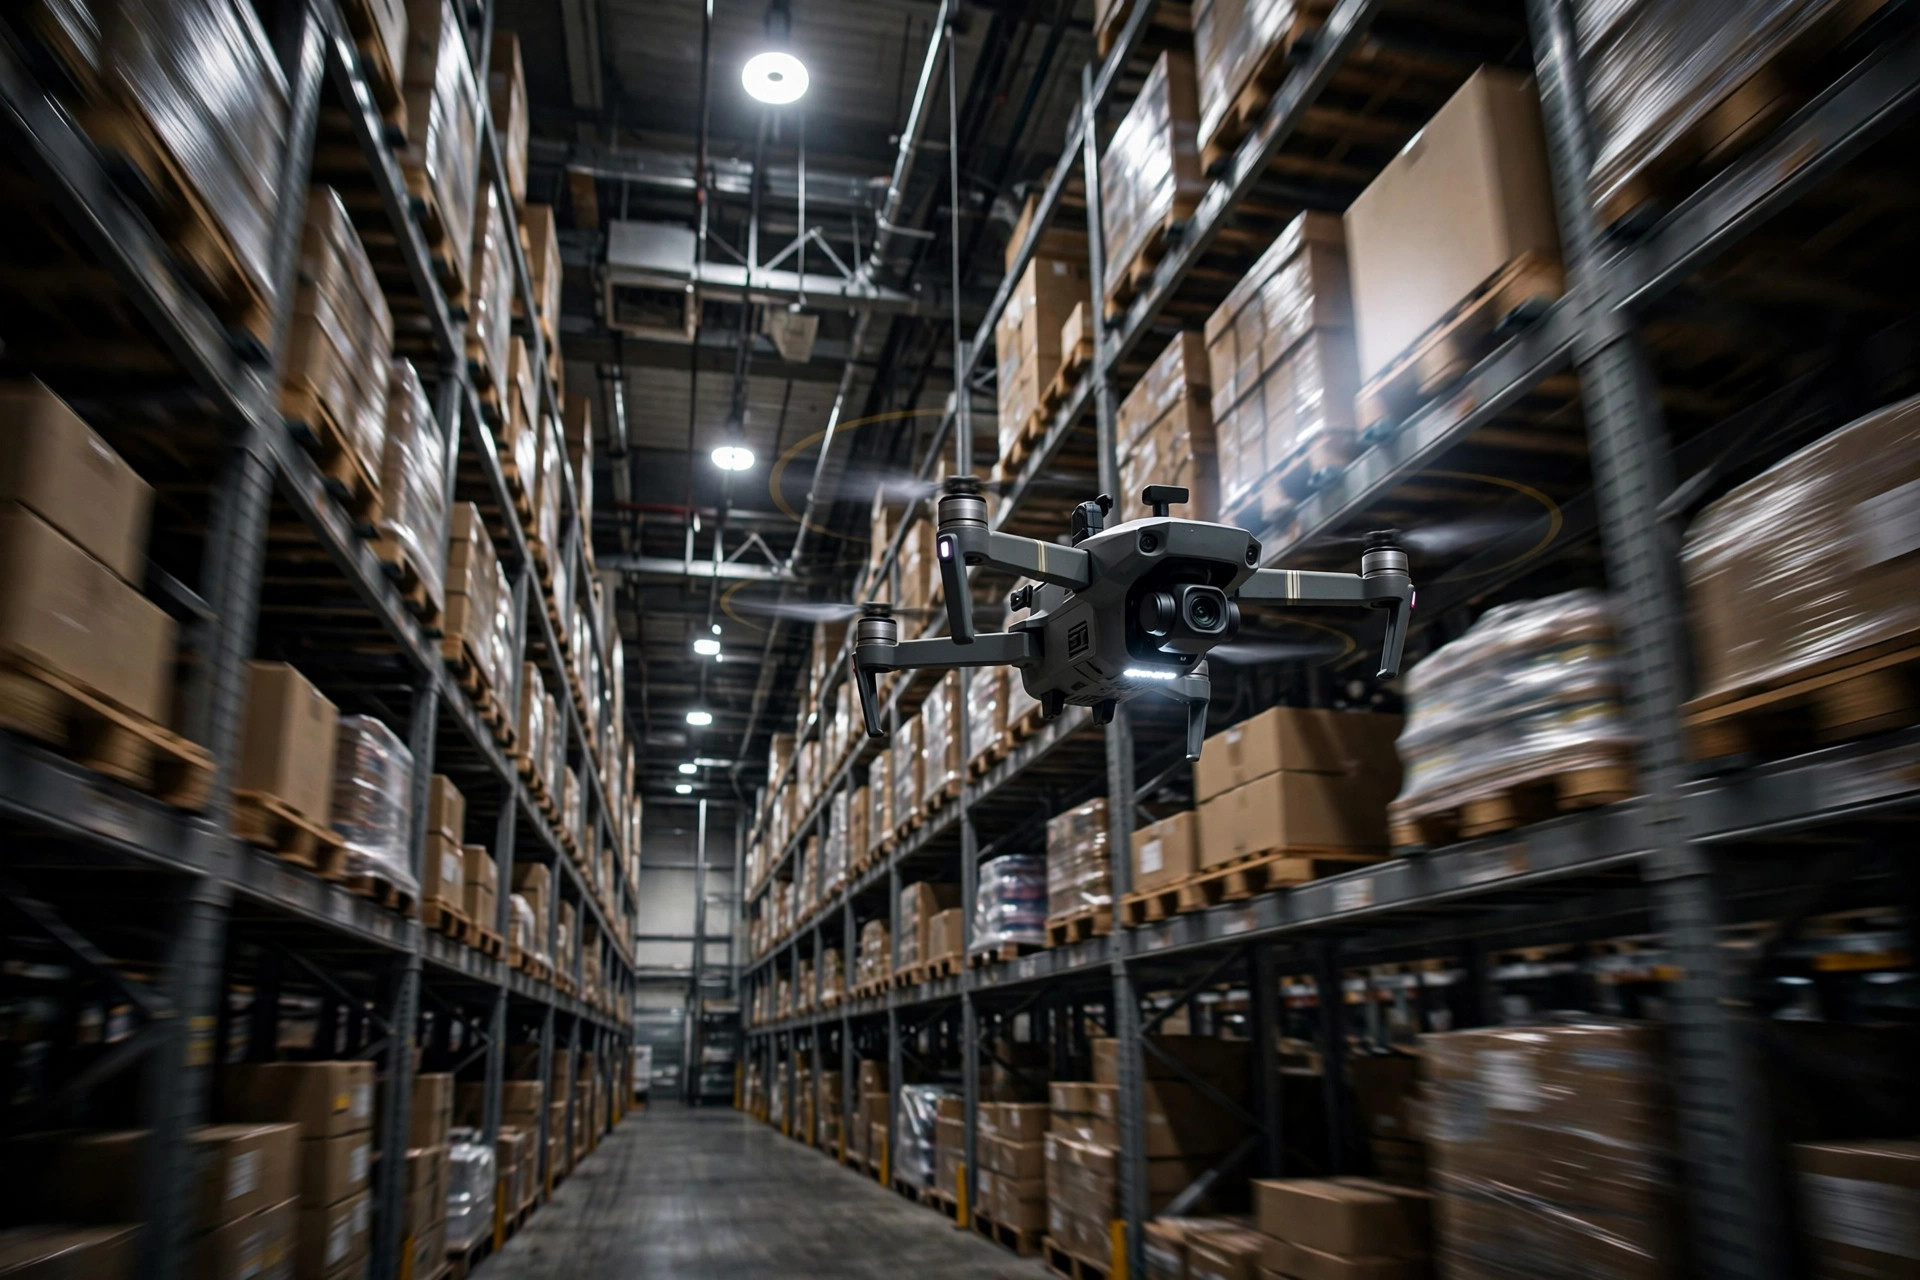
The setup: AGVs or drones carrying cameras patrol the aisles while OCR reads location codes and product labels, reconciling line by line against WMS book inventory. One warehouse measured it: a full 50,000-location sweep in 4 hours with 99%+ discrepancy detection — beyond what three days of manual labor achieves.
Key parameters: cameras must resolve barcodes at 3 meters; patrol speed stays under 1.5 m/s, beyond which OCR accuracy drops below 95%.
2. Anomaly Detection: Land the Five High-Frequency Scenarios First
| Scenario | Camera placement | Measured detection rate | |---|---|---| | Empty location holding stock / stocked location empty | Aisle patrol | 99%+ | | Obscured or damaged location labels | Aisle patrol | 97% | | Damaged goods, deformed packaging | Fixed cameras at receiving | 95% | | Leaning pallets, over-height stacking | Fixed cameras at outbound | 96% | | Blocked fire lanes | Fixed cameras in aisles | 98% |
These five cover 80% of daily warehouse anomalies. Don't start with fine-grained "wrong SKU in location" recognition — cross-SKU visual discrimination needs massive sample sets, and its ROI ranks lower.
3. Roll Out in Three Steps: Fixed Cameras to Full Automation
Step one, fixed-camera pilots at receiving and the high-value zone — validate detection rates in two weeks. Step two, mobile patrols: AGVs or drones covering the whole building. Step three, auto-generate count tasks in the WMS — discrepancies dispatch straight to investigators. The loop only closes at step three.
Each step needs a clear acceptance metric before proceeding. Too many projects blanket the building with cameras while step one still underperforms — scale never fixes a broken pilot.
4. Data Is the Foundation: 500 Labeled Images per Anomaly Type
Model quality equals data quality. Field experience: at least 500 labeled samples per anomaly class, and the training set must cover lighting shifts across shifts — the biggest trap. A model tuned in daylight can lose 10 points of accuracy under night lighting. Reflective labels are the other classic pitfall; polarizing filters or adjusted shooting angles solve most of it.
Field Case: Inventory Accuracy 96.5% → 99.2%
A 3C warehouse, one year after vision-based counting went live: inventory accuracy rose from 96.5% to 99.2%, annual count labor fell from 40 person-days to 6, and "can't-find-it" order cancellations dropped 70%. Total investment ran about $900K (40 fixed cameras plus 2 patrol AGVs) — paid back within a year.
Pitfalls to Avoid
- Don't blanket the building on day one. Pilot, validate, then scale — never use scale to hide underperforming detection.
- Handle privacy first. Cameras see faces; the design must include face blurring, with employee notice and policies in place before go-live.
- Anomalies must close the loop in the WMS. Alerts without dispatched tasks are theater. Detections have to auto-create count or investigation tasks with clear ownership.
Where the Money Goes: Cost Structure
For a 50,000-location warehouse, a vision deployment breaks into roughly four buckets:
| Cost item | Share | Notes | |---|---|---| | Hardware (cameras, AGVs/drones, servers) | 50% | Buy industrial-grade cameras; don't economize | | Software (algorithm licensing/dev) | 20% | Per-site or annual licensing | | Implementation (install, tuning, labeling) | 20% | Labeling samples is the labor hog | | Annual operations | 10%/yr | Model iteration, equipment maintenance |
Money-saving tips: rent the patrol AGVs during the pilot instead of buying; pre-train on public datasets then fine-tune on your own images to halve sample requirements; put fixed cameras on high-value and high-error zones first — the 20% of positions with the best ROI.
Remember: hardware is one-time spend; data and operations are continuous. A project budgeted for equipment but not for operations shouldn't start.
From Pilot to Full Building: Three Acceptance Gates
Hard metrics at every step — advance only on a pass:
- Pilot gate (month 1): 10 fixed camera positions, all five anomaly types at ≥93% detection, false-positive rate <5%. Miss it and you tune data and models — no new positions.
- Expansion gate (months 2–3): patrol AGVs live, 50% of locations covered, discrepancy detection ≥98%, one full sweep under 8 hours.
- Full-building gate (months 4–6): detections auto-create WMS count tasks, close-the-loop rate (detect → resolve) ≥95%, inventory accuracy ≥99%.
Business and IT co-sign each gate's acceptance report. The classic death pattern is skipping the pilot gate and scaling anyway — with weak detection, more cameras just drown real issues in false alarms faster.
The Takeaway
Vision AI's best warehouse entry point is location audits plus the five high-frequency anomalies: start with fixed-camera pilots, train across lighting conditions, and wire detections straight into WMS task dispatch. At 99%+ inventory accuracy, counting stops being a campaign and becomes a daily patrol.