

The Problem: Made-Up KPIs Are Driving Away Your Best People
"UPH must hit 150, miss it and lose pay." A new warehouse manager's first-week decree. Three months later, UPH did hit 150 — at the cost of the error rate jumping from 0.4% to 1.2%, five veteran employees quitting, and complaint tickets doubling. The KPI wasn't wrong; the design was: it measured speed and ignored quality.
The core tension in warehouse KPIs: speed, quality, and cost fight each other. A good KPI system doesn't maximize every metric — it finds the balance point, and it sets targets frontline workers find "a stretch, but reachable." Here is how to set the three core metrics.
The Method: Setting Targets for Three Metrics
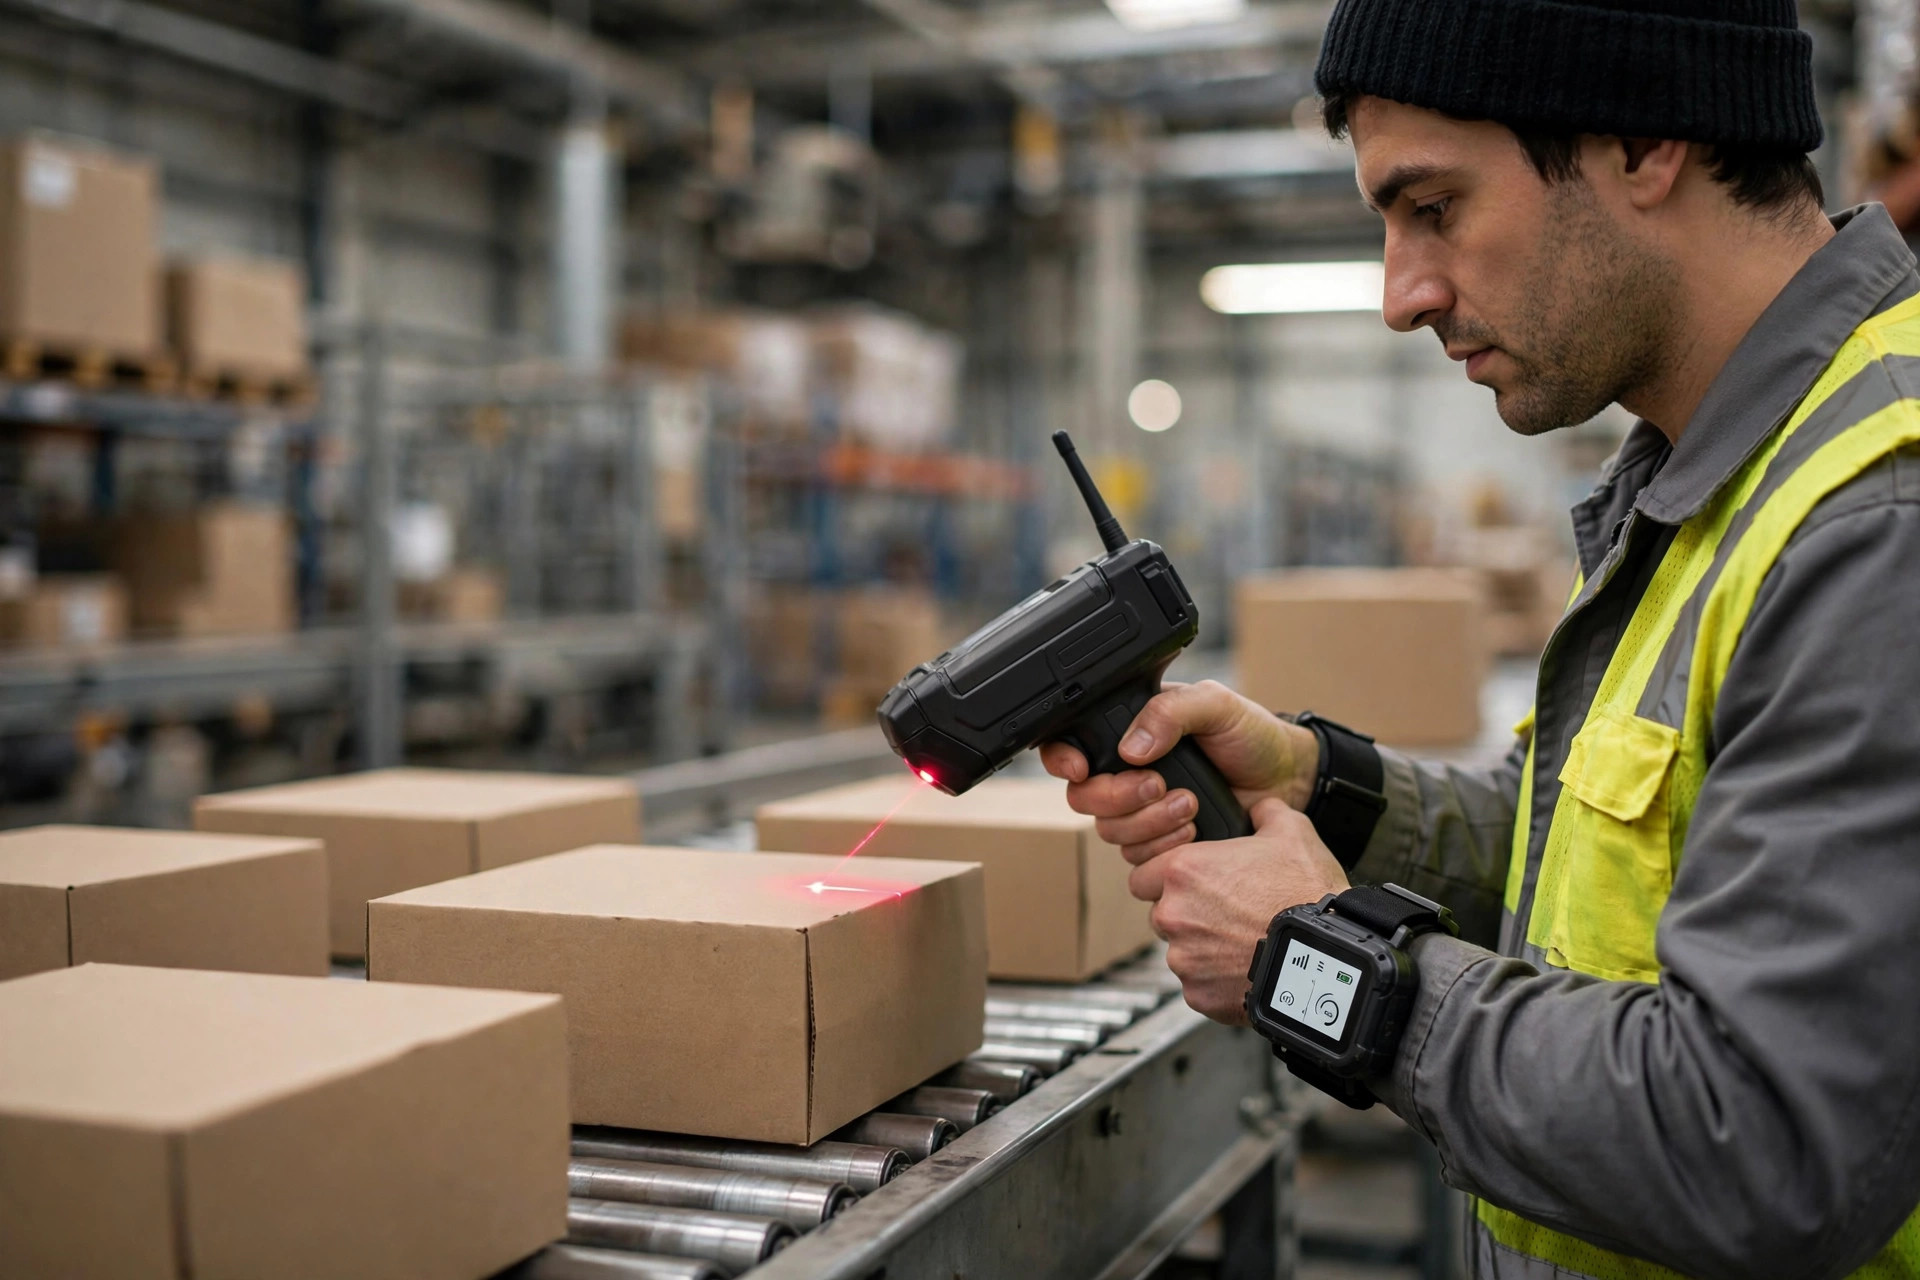
1. UPH (units per hour): set it with percentiles, not gut feel
UPH = standard work completed per hour (pick lines, receipts, packs). The scientific way to set the target:
- Collect 4–8 weeks of actual UPH data per employee per shift, excluding abnormal shifts (equipment breakdowns, system outages);
- Take P50 (the median) as the qualifying line: half the team hits it, and the other half can with effort;
- Take P75 as the excellence line: only a quarter hit it — attach bonus pay;
- Take P90 as the benchmark line: post it for recognition only, never for evaluation — or you'll breed "speed at all costs."
Example: a pick team's 8-week data shows P50 = 110 lines/hour, P75 = 135, P90 = 158. Set qualifying at 110, excellence at 135. Never set P90 as the qualifying line — that declares 90% of your team "failing," and morale collapses within a month.
Set UPH separately by task type — never one number for the whole building:
| Task | Qualifying reference (P50) | Notes | |---|---|---| | Full-pallet receiving | 25–35 pallets/hour | Includes scanning, QC, system confirmation | | Each picking | 90–130 lines/hour | Depends on line count and travel distance | | Audit & pack | 40–60 orders/hour | Includes consumables, label application | | Loading | 300–500 units/hour | Depends on palletizing |
Note: these are common industry ranges for getting started — your warehouse's real data always beats any reference value.
2. Accuracy: set it per process step, 99.5% overall
Accuracy KPIs must be broken down by step, not parked in a single "warehouse accuracy" number:
- Pick accuracy: target ≥ 99.5% (1 miss per 200 lines). Below 99% triggers mandatory root-cause analysis.
- Audit catch rate: errors caught at audit ÷ total orders — target keeping "escaped errors" under 0.1%. Auditing isn't theater; measure what it catches.
- Inventory accuracy: target ≥ 99.5% (see "How to Get Inventory Accuracy to 99.5%" in this series), measured monthly.
Key design: when accuracy misses, the UPH bonus gets discounted. Example: a worker hits the excellence UPH line but pick accuracy is 98.8% (below 99.5%) — bonus pays at 50%. Speed and quality must be bundled, or workers will always trade quality for speed. That's human nature, not a character flaw.
3. Shrinkage: separate controllable from uncontrollable
Shrinkage rate = (damage + loss + expired write-offs) ÷ outbound value. Classify before setting targets:
| Shrinkage type | Controllable? | Target | How to measure | |---|---|---|---| | Handling damage (drops, crushes, forklift hits) | Yes | < 0.15% | Team KPI; over-target docks team bonus | | Loss (book-to-physical gaps never found) | Yes | < 0.05% | Individual/team; triggers investigation | | Expiry write-offs | Partly | < 0.3% (food/pharma) | Owned by planners and inventory control, not frontline | | Transit damage (after outbound) | No | Tracked separately | Excluded from warehouse KPIs; goes to claims |
Charging uncontrollable shrinkage to frontline workers is the fastest way to collapse a KPI system. Workers conclude "I can't win no matter what" — and stop trying entirely.
Field Case: A 3PL Warehouse's KPI Rebuild
Background: a 3PL warehouse in Southern California whose entire KPI system was one line: "UPH 130, miss it and get warned, two warnings and you're fired." Results: 1.5% error rate (monthly client complaints), 12% monthly turnover, three veterans left standing.
The rebuild: Month 1, kill rank-and-yank, run 6 weeks of data to set P50/P75 lines. Month 2, launch a dual "UPH + accuracy" bonus (accuracy miss = bonus halved). Month 3, team-level shrinkage targets, with handling-damage overruns docking the supervisor's bonus (not frontline pay).
Results after 6 months: median UPH rose naturally from 118 to 134 (workers stopped passive resistance), error rate fell from 1.5% to 0.4%, monthly turnover dropped from 12% to 4%. The manager's summary: "I used to think the team was lazy. Turns out the KPIs had turned them into 'fast and wrong.'"
Pitfalls to Avoid
- No more than 5 KPIs. Frontline workers can't remember 10 metrics. Keep individuals to 3 (speed, quality, attendance/safety) and add 1–2 at team level (shrinkage, 5S).
- Recalibrate targets at least yearly. Process improvements and equipment upgrades move P50 upward — targets should follow; business-mix changes (more small orders) move it down. Judging today's workers by three-year-old targets is indefensible.
- Safety is a veto, not a bonus input. Injuries and fire-code violations get their own red lines with direct consequences — never converted into "minus 10 points." Safety is a floor, not a KPI.
- Rank within peer groups. Rank new hires (under 3 months) separately from veterans, or rookies sit at the bottom forever and quit in month three. Grouped rankings plus most-improved awards keep newcomers.
Summary
Four sentences for warehouse KPI design: set UPH with P50/P75 so most people can reach it; bundle accuracy with speed to prevent "fast but wrong"; split shrinkage into controllable vs. not, and never charge frontline for what they can't control; keep it under 5 metrics and recalibrate yearly. A KPI is a ruler, not a whip — a ruler tells people where they stand; it doesn't chase them away. Before finalizing targets, ask yourself: if I were the picker, would I want to strive for this?