
If Payback Is Fuzzy, the Proposal Dies
"How fast does this pay back?" — the inevitable question in every automation approval meeting, and the easiest to fumble. Answer "about two years," get asked "show me the math," stammer — and the project is as good as dead.
Payback period itself is simple: total investment divided by annual net benefit. The devil is in the line items: omit civil works and downtime losses from costs, count "redeployed" workers as "eliminated" in benefits, and your payback looks twice as rosy as reality — then overruns and delays torch the boss's trust. This article gives you a ready-to-use ROI template: cost items, benefit items, formulas, and sensitivity analysis, step by step to a payback number that survives interrogation.
1. Cost Items: Seven Checks You Must Not Miss
Total investment has seven line items. Newcomers almost always miss the last three:
| # | Cost item | What it covers | Commonly missed | |---|---|---|---| | 1 | Equipment hardware | Robots, conveyors, racking | — | | 2 | Software | WMS modules, dispatch systems, licenses | Recurring license fees | | 3 | Implementation services | Installation, commissioning, WMS integration, training | Integration man-days | | 4 | Civil works | Floor loading, power upgrades, network, fire protection | Power upgrades cost most | | 5 | Downtime losses | Capacity lost during implementation | Doubles if done in peak season | | 6 | Spares | First spares batch, safety stock | — | | 7 | First-year operations | Maintenance contract, power, consumables | Power is often forgotten |
Rule of thumb: actual total ≈ quoted price × 1.2. The quote covers items 1–3; the remaining four typically add 15–25%. Put a "contingency (10%)" line in the template — bosses find it reassuring, not alarming.
2. Benefit Items: Four Benefit Types, No Double Counting
Annual benefits come in four types. Don't double-count:
- Labor savings: eliminated headcount × fully loaded annual cost. Key: only count heads truly eliminated — redeployments to other departments are "freed up," not "saved"; only unfilled attrition counts. Model conservatively at 70% of replaceable headcount.
- Error reduction: error-rate improvement × annual volume × cost per error. Cost per error = return freight + reshipment + service cost + churn allocation.
- Capacity/revenue uplift: new capacity from automation × gross margin per unit. Only counts if capacity actually becomes orders — idle capacity is not a benefit.
- Other: space savings (less leased area), energy reduction (freezer cases), fewer injuries, compliance value.
Annual net benefit = sum of the four − annual operating cost (maintenance + power + consumables + software fees).
3. Core Formulas: Payback, ROI, NPV
| Metric | Formula | Reading | |---|---|---| | Payback period | Total investment / annual net benefit | Years to break even | | ROI | Annual net benefit / total investment × 100% | Annualized return % | | NPV | Discounted N-year benefits − investment | > 0 means viable; for large projects | | IRR | Discount rate where NPV = 0 | Viable if above cost of capital |
Small and mid-size projects need only the first two. Example: $444K (¥3.2M) invested, $278K (¥2M) annual net benefit → payback 1.6 years, ROI 62.5%. For ten-million-plus projects, add NPV with the company's cost of capital (typically 8–12%) as the discount rate.
4. Template Design: Ready to Use
Turn the cost and benefit items above into a spreadsheet — that's your ROI template:
Sheet 1: Investment
- Column A: the seven cost items (equipment, software, implementation, civil works, downtime losses, spares, first-year ops, 10% contingency)
- Column B: amounts; Column C: basis/notes; total at the bottom = total investment
Sheet 2: Benefits
- Labor savings: eliminated headcount × annual cost × 70% (conservative factor)
- Error reduction: error-rate improvement × annual volume × cost per error
- Capacity uplift: new capacity × margin per unit (needs sales sign-off)
- Other: space/energy/safety
- Less: annual operating cost → annual net benefit
Sheet 3: Results
- Payback, ROI, NPV auto-computed
- Sensitivity table (next section)
Template discipline: every number gets a "basis" column — headcount from HR, error rates from WMS, unit costs from finance. Numbers without a basis get picked apart in the meeting.
5. Sensitivity Analysis: Answering the Boss's "What If"
The boss will ask: "What if we can't save that many people?" "What if the equipment is late?" Sensitivity analysis prepares the answers in advance:
| Scenario | Annual net benefit | Payback | |---|---|---| | Base | $278K (¥2M) | 1.6 years | | Pessimistic (benefits −30%) | $195K (¥1.4M) | 2.3 years | | Optimistic (benefits +20%) | $333K (¥2.4M) | 1.3 years | | Investment +20% overrun | $278K on $533K (¥3.84M) | 1.9 years |
Say the key conclusion out loud: "Even in the pessimistic case — benefits at 70% — payback is 2.3 years, still inside the 3-year line." That one sentence beats any equipment spec.
Case Study: ROI Workup for an AGV Project
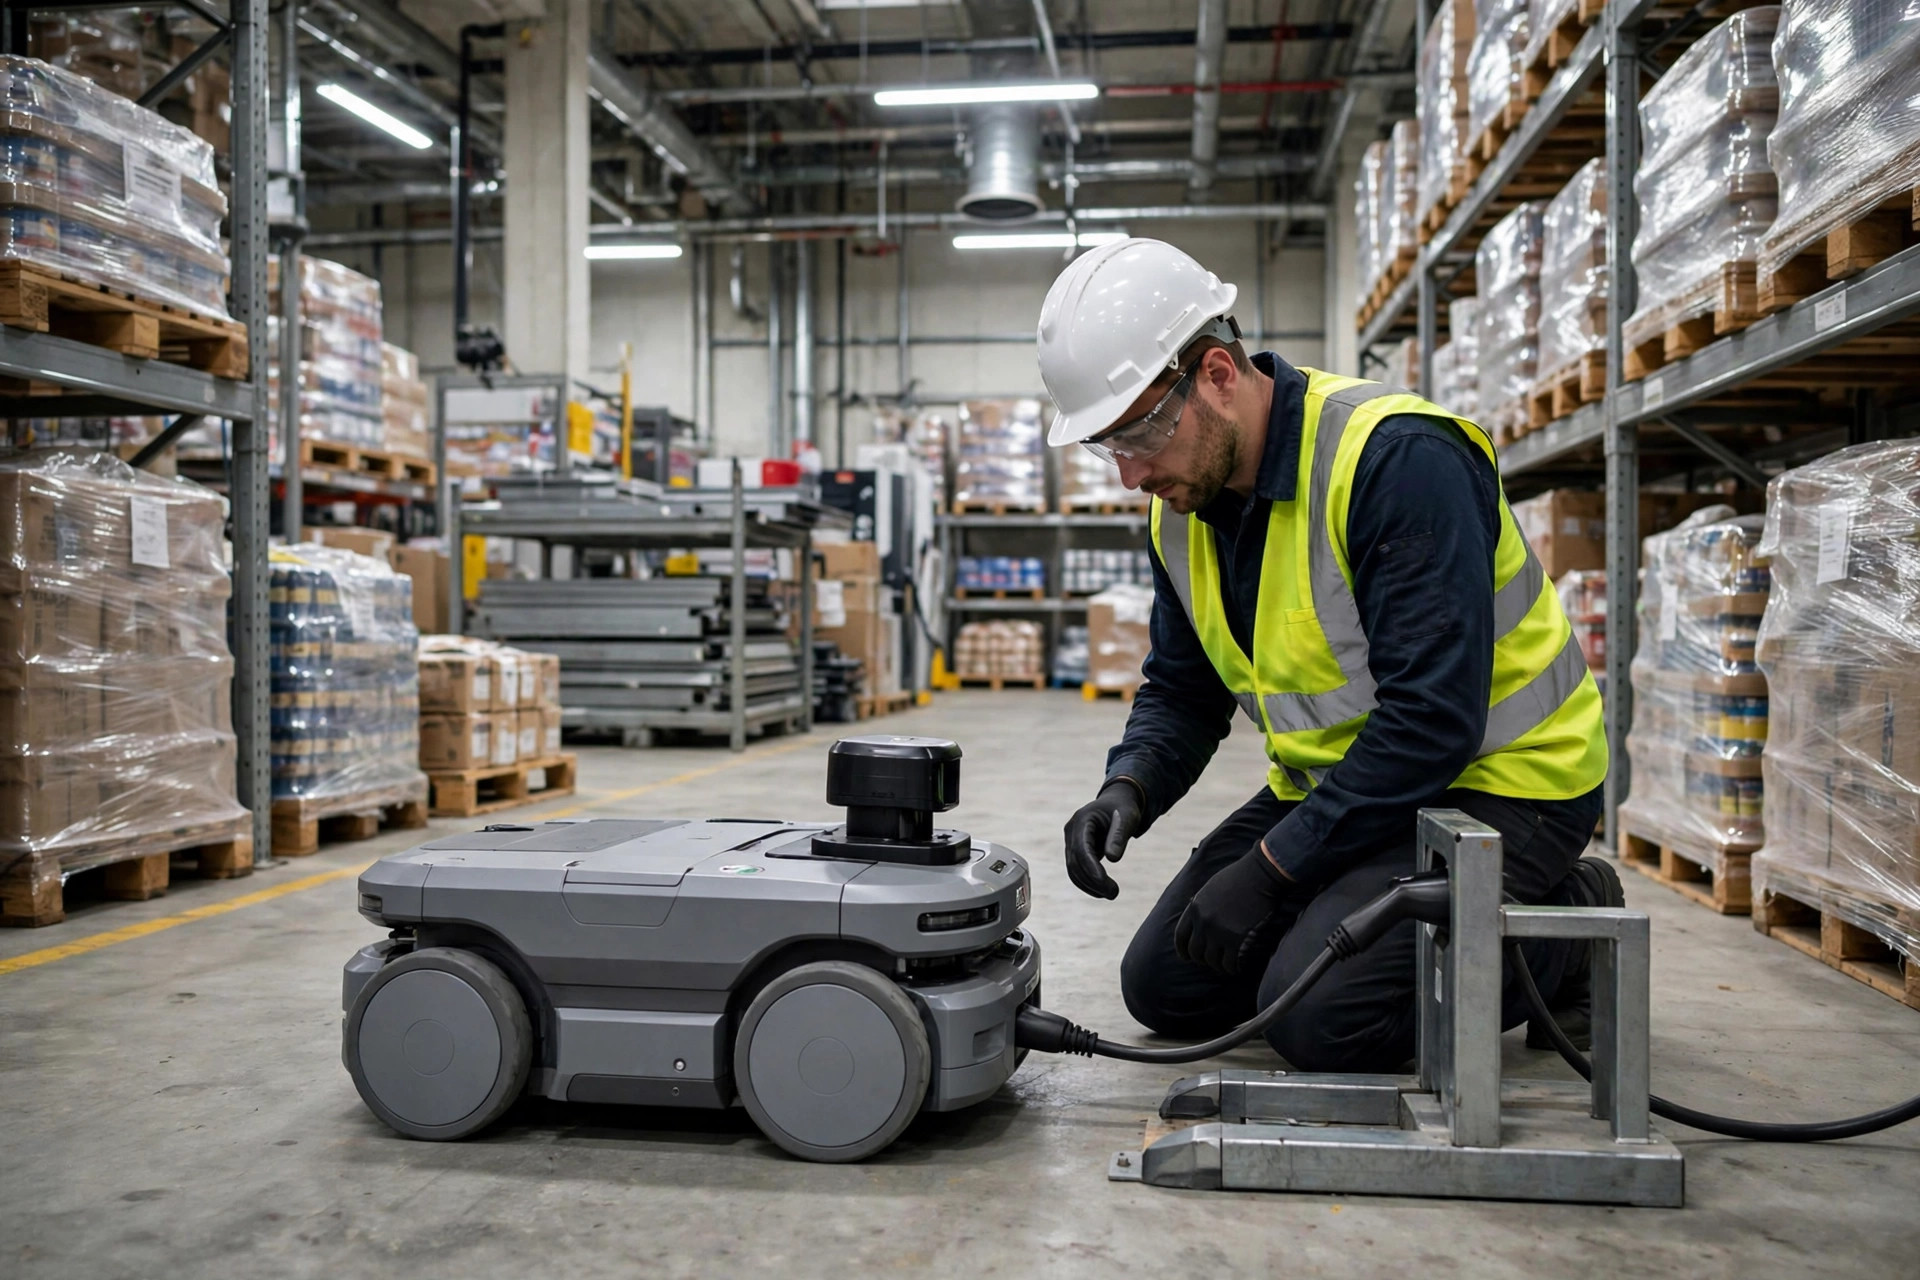
Background: a 3C manufacturing warehouse moving materials to production — 8 AGVs replacing 12 forklift operators.
Investment: AGV hardware $389K (¥2.8M) + dispatch system $35K (¥250K) + implementation $21K (¥150K) + floor/network rework $25K (¥180K) + first-year maintenance $17K (¥120K) + 10% contingency = $535K (¥3.85M).
Annual benefits: labor 12 × $21K (¥150K) × 70% = $175K (¥1.26M); injury/downtime reduction $35K (¥250K); forklift fuel/maintenance $42K (¥300K); total $252K (¥1.81M). Less $49K (¥350K) annual ops → annual net benefit $203K (¥1.46M).
Result: payback = 535 / 203 ≈ 2.6 years, ROI 38%. Sensitivity: pessimistic (benefits −30%) → 3.8 years, slightly over the 3-year line — disclosed honestly in the report, paired with a two-phase risk-reduction plan. Approved.
Pitfalls
- Counting redeployments as cuts: the most common inflation. Saved heads must mean "positions eliminated, never rehired" — internal transfers are reshuffling, not savings.
- Omitting annual operating cost: maintenance contracts, power, consumables, software fees — tens of thousands a year, small or large. Skip them and the payback is fiction.
- Modeling on peak capacity: 365 days at full tilt is fantasy; 70% utilization is realistic. Use historical utilization; peak-season spikes are reference only.
- Ignoring cost of capital: on ten-million-plus projects, skipping NPV is malpractice. The company's borrowing cost (8–12%) is the hurdle rate — IRR below it means the project loses money.
Takeaway
The ROI template is three sheets: investment (seven items + 10% contingency), benefits (four types − annual ops), results (payback + ROI + sensitivity). Document the basis for every number, haircut benefits 20%, inflate investment 20%, and keep the pessimistic payback inside 3 years — a payback computed that way is hard for any boss to poke holes in. Templates are static; rigor is what makes them work: the more conservative the math, the smoother the project.