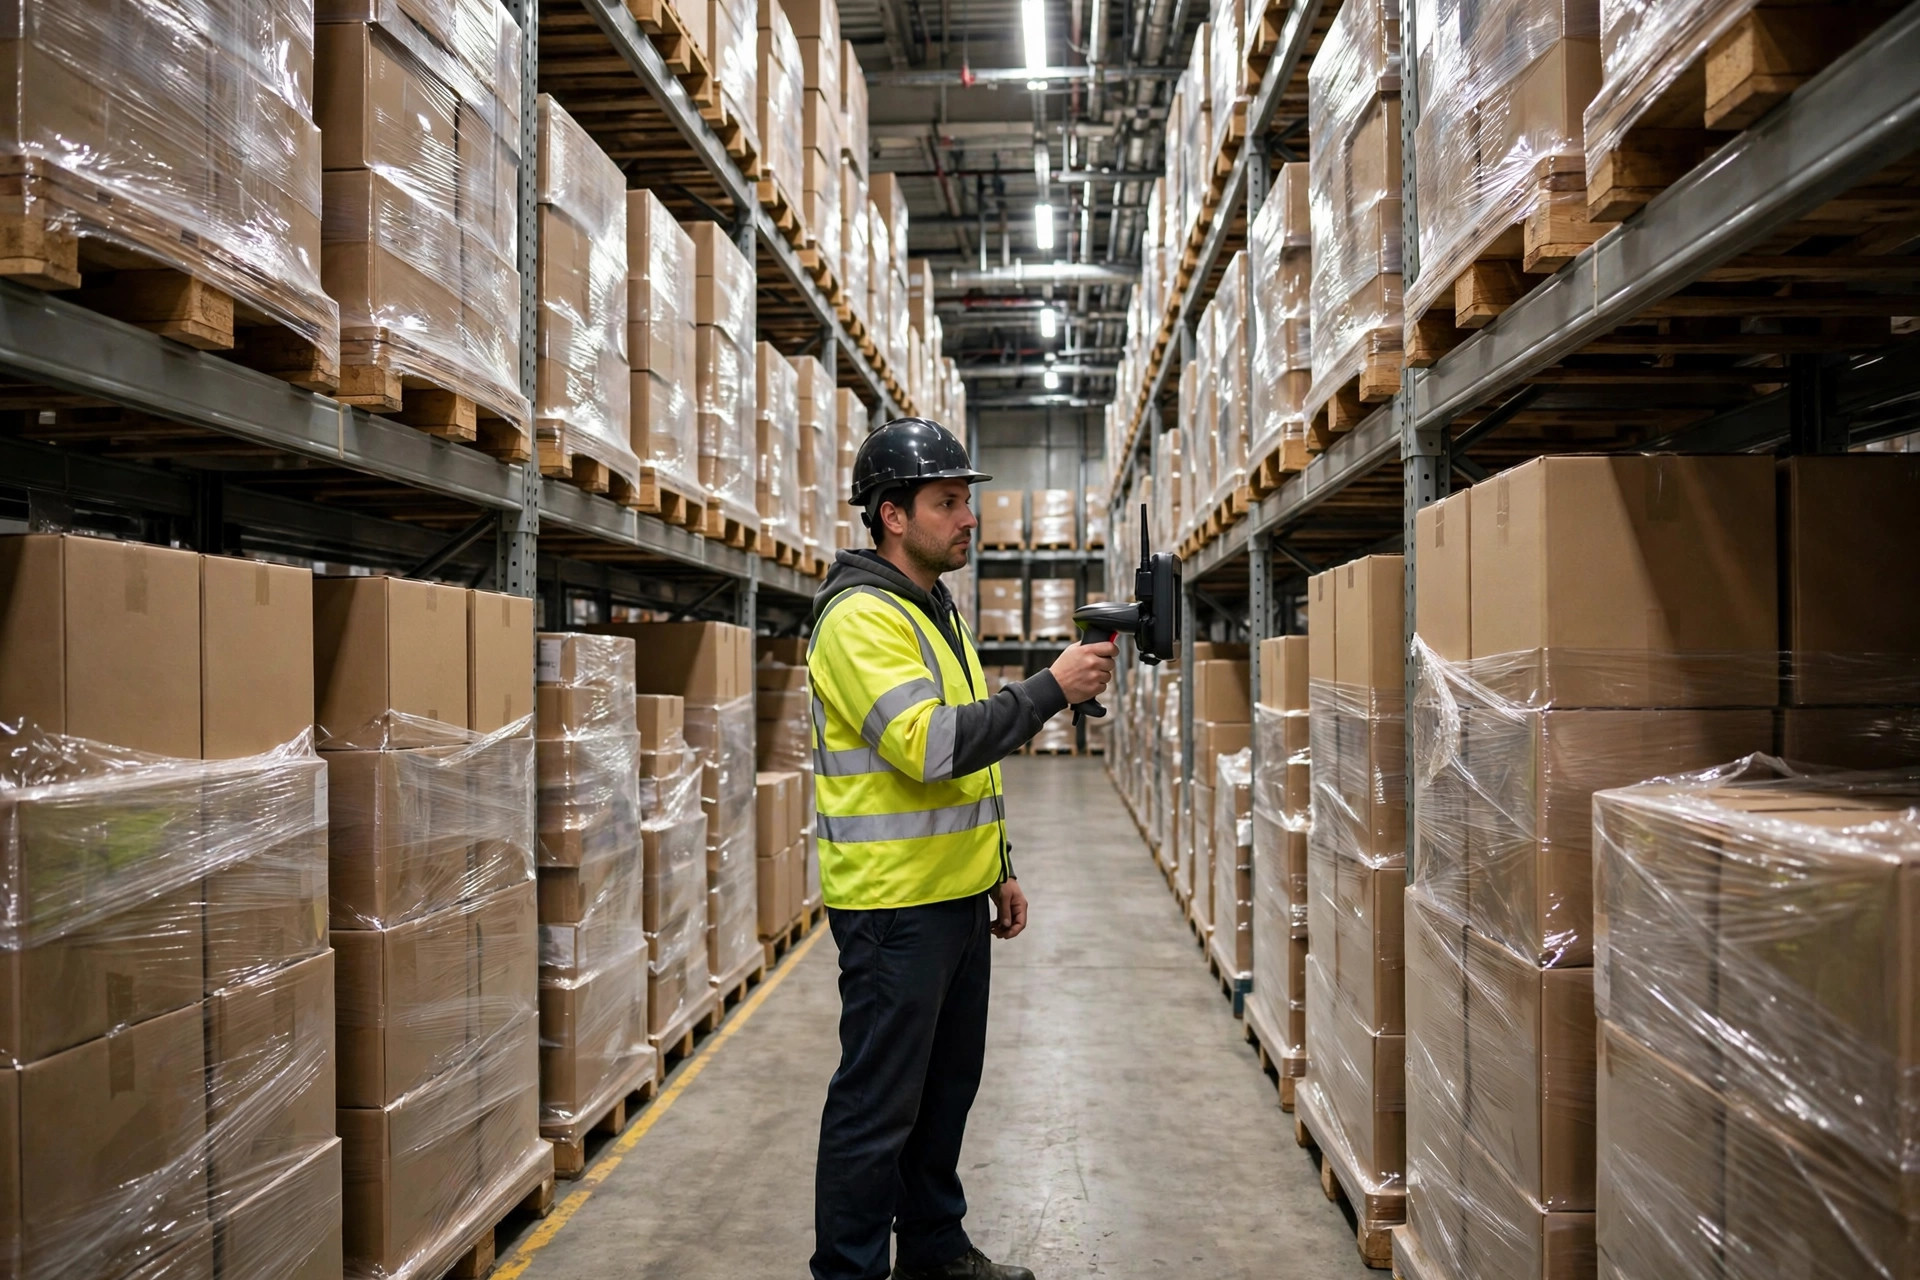

The Problem: Half a Point Hides Double the Stockouts
99% inventory accuracy sounds excellent — but for a warehouse with 10,000 SKUs, 1% means 100 SKUs with wrong book quantities. If 20 of those are hot sellers, the cancelled orders, complaint tickets, and expedited replenishment can cost tens of thousands of dollars a month. Moving from 99% to 99.5% often cuts stockout-related losses in half. The higher you climb, the more each tenth of a point is worth.
A medical-device warehouse we worked with took 14 months to go from 96.8% to 99.6%. The post-mortem showed the biggest contributor was not counting — it was four lines of defense that stop errors from happening. Here is the full methodology.
The Method: Four Lines of Defense
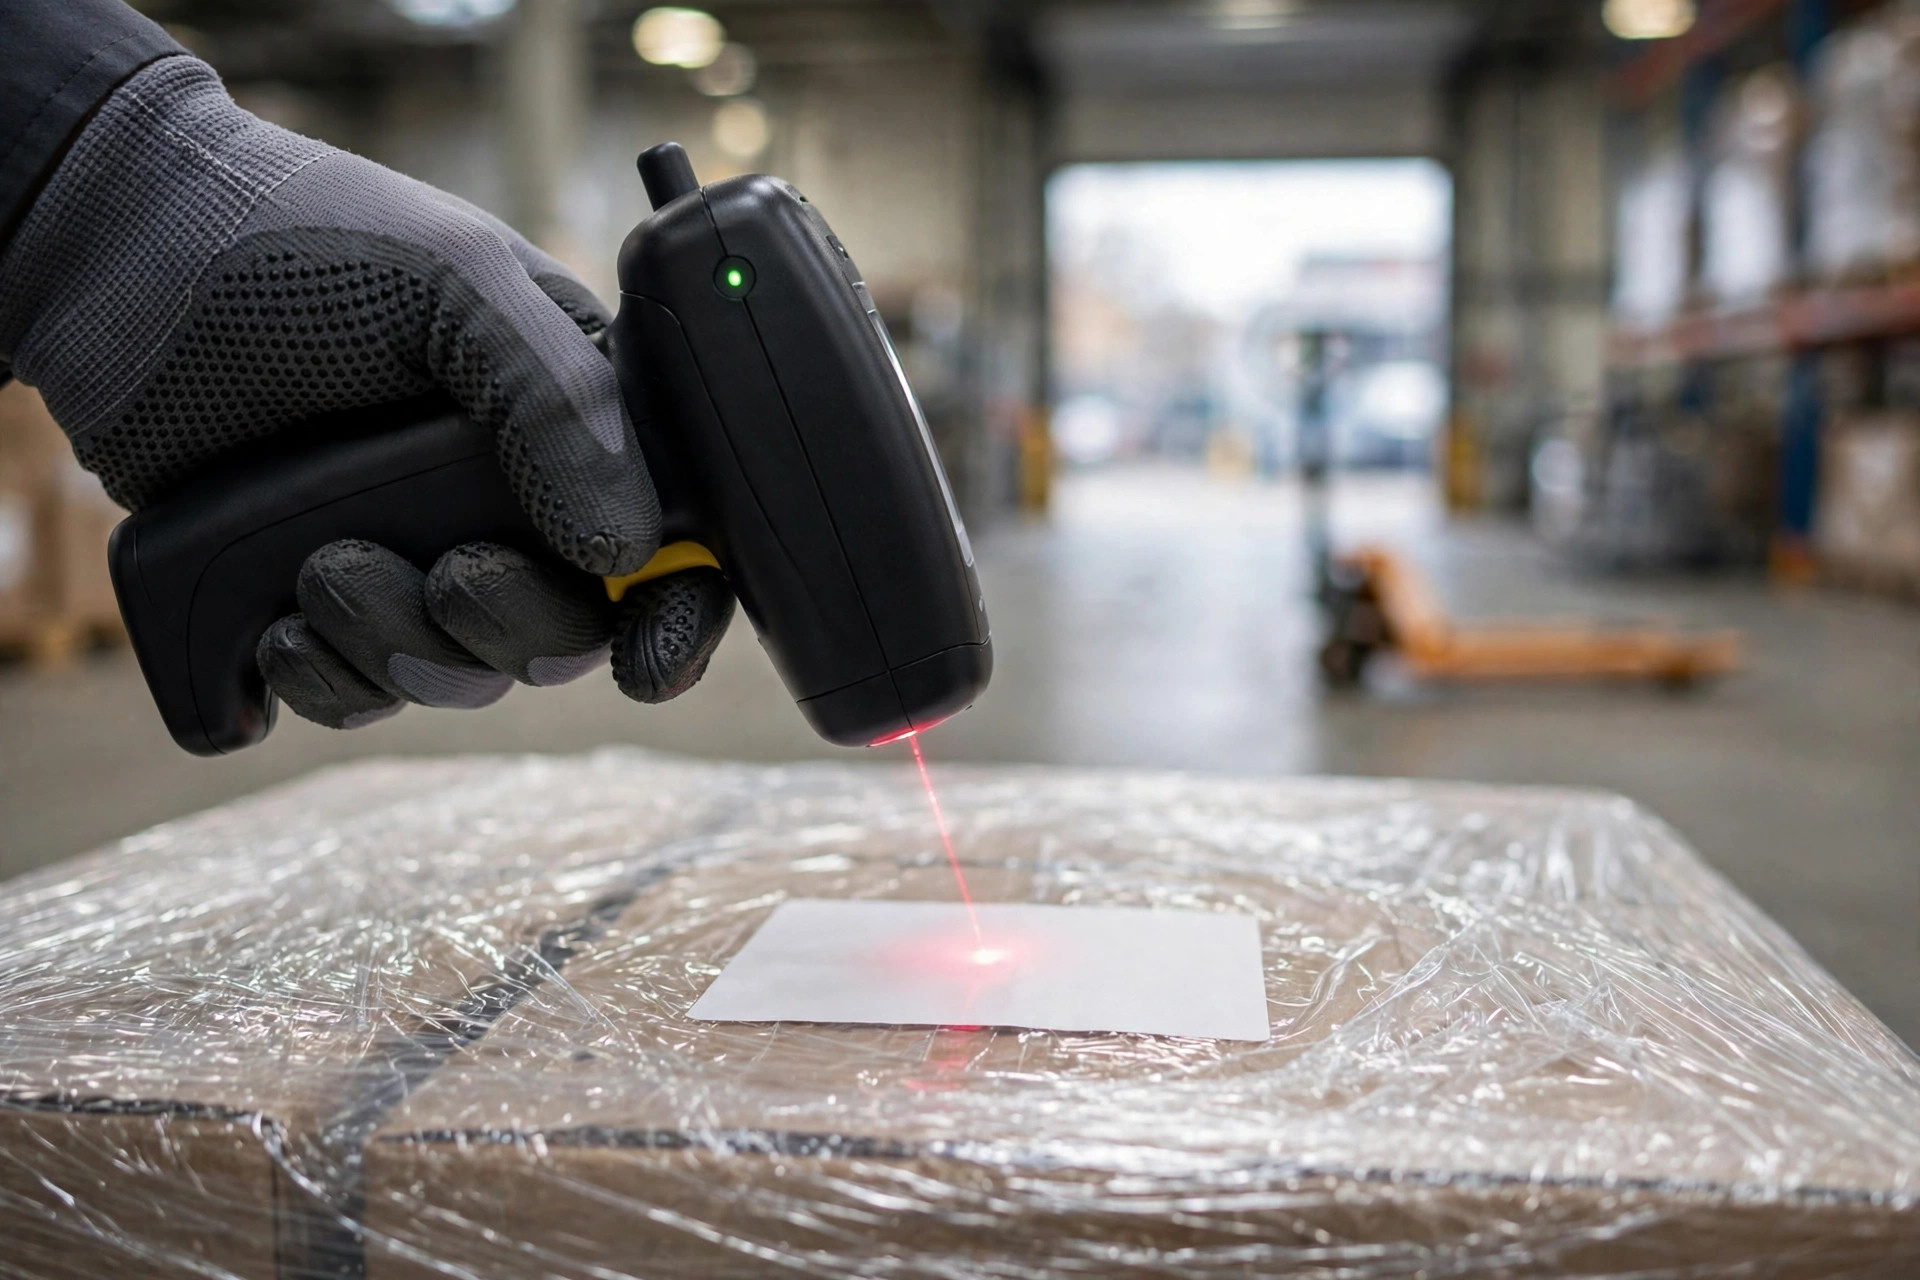
Line 1: Receiving — where 70% of variances are born
Industry data shows more than 70% of inventory variances trace back to receiving and putaway. The practices:
- ASN appointments + arrival verification: deliveries without an ASN go through an "exception receiving" flow — staged in a separate holding area, ownership resolved within 24 hours, never put away directly.
- Scan everything, don't sample: many warehouses spot-check 10% for "trusted" suppliers — that is the ceiling keeping you below 99%. Switch to full pallet-label scanning plus breaking open 1–2 cartons per pallet. Labor rises about 15%; source variances fall 60%.
- Close variances before the driver leaves: overages, shortages, and damage must be confirmed and photographed before the truck departs, with a claim filed in the WMS. Reconcile the next day and the evidence is gone.
Line 2: Location discipline — one location, one SKU
One-SKU-per-location is the foundation of 99.5%. Mixed locations are the most common accuracy killer in small and mid-size warehouses: pickers grab the wrong item, counts never reconcile, system transfers tangle — it all starts here.
| Location strategy | When it fits | Accuracy impact | |---|---|---| | Fixed one-SKU-per-location | < 5,000 SKUs, stable velocity | Highest; easy to manage; ~10% less space utilization | | Floating one-SKU-per-location | Many SKUs, volatile velocity | High; needs strict WMS control; better space use | | Multi-SKU per location | Huge SKU counts, tiny parts, e-commerce | Low — unless every pick scans the SKU barcode with light-directed guidance |
If SKU counts make strict one-per-location impossible, the floor is this: every SKU in a shared location gets its own physically separated container, and picking forces an SKU barcode scan — never a location-only scan.
Line 3: Scan every move — let the system "see" the freight
Warehouses at 99.5% share one trait: every movement of goods has a scan record. Receive scan, putaway scan (location + item), pick scan, audit scan, ship scan. All five, no skipping.
The most critical is putaway scanning: plenty of warehouses scan at receiving and then put away from memory — 3% of goods land in the wrong location, and every downstream record is wrong from there. Force a "location–SKU" match verification on the handheld at putaway; the transaction cannot confirm on mismatch. After one warehouse enabled this check, putaway errors fell from 140 per month to 9.
Line 4: Tiered variance response — small variances don't sleep over, big ones stop the line
| Tier | Criteria | Response | |---|---|---| | L1 minor | ≤ 2 units and < $20 | Counter re-verifies within 4 hours of shift | | L2 significant | > 2 units or $20–$500 | Supervisor on-site confirmation within 24h + root cause | | L3 major | > $500 or same SKU off 3 days running | Manager involved; freeze the SKU's moves until resolved |
Tiered response exists for one reason: stop small variances from compounding into craters. Most warehouse black holes started as variances someone dismissed as "no big deal" three months earlier.
Field Case: A Medical-Device Warehouse's 14 Months
Background: a 3PL medical-device warehouse in Arizona, ~6,000 SKUs, with a contractual accuracy requirement (≥99.5%, with service credits for misses). Starting point: 96.8%, losing about $80,000 a year in credits.
Phased rollout: months 1–3, full receiving scans + same-day variance closure → 98.1%. Months 4–6, one-SKU-per-location conversion + mandatory putaway verification → 99.0%. Months 7–10, cycle counting (A-class weekly) + tiered variance response → 99.4%. Months 11–14, grinding out the last tenth: dedicated bins for chronic-error SKUs, light-directed picking aids — stabilizing at 99.6%.
The lesson: 96% → 99% took 6 months; 99% → 99.5% took 8 more. The last half point is won on details — barcode label print quality, whether there are enough bins, whether handheld batteries survive a shift. "Small stuff" sets the ceiling.
Pitfalls to Avoid
- Don't set the target at 100%. 100% is an unsustainable myth; targeting it only incentivizes falsification. 99.5% is the realistic ceiling for excellent warehouses — set it there and the incentives stay credible.
- Define the numerator and denominator precisely. Per location or per SKU? Is "within tolerance" accurate, or only exact matches? Without definitions, 99.5% is self-congratulation. Our recommendation: location × SKU dimension, zero tolerance, rolling monthly.
- Counters can't grade their own homework. The person who created a variance can't verify it. Verification must be done by someone else — non-negotiable.
- Zero out shadow inventory. Staging, hold, and repair areas with goods not in the WMS are accuracy black holes. Every physical spot must have a system location code.
Summary
The 99.5% methodology in one sentence: 70% of variances die at receiving and putaway, so 70% of your effort belongs at the source. One-SKU-per-location is the foundation, full-process scanning is the rebar, cycle counting is the inspection patrol, tiered response is the fire department. Do all four and 99.5% follows naturally; count diligently without source control and you're just pouring water into a leaking bucket. Start with the math: what is each tenth of a point of accuracy worth to your warehouse in real dollars? Once that number is clear, the motivation takes care of itself.