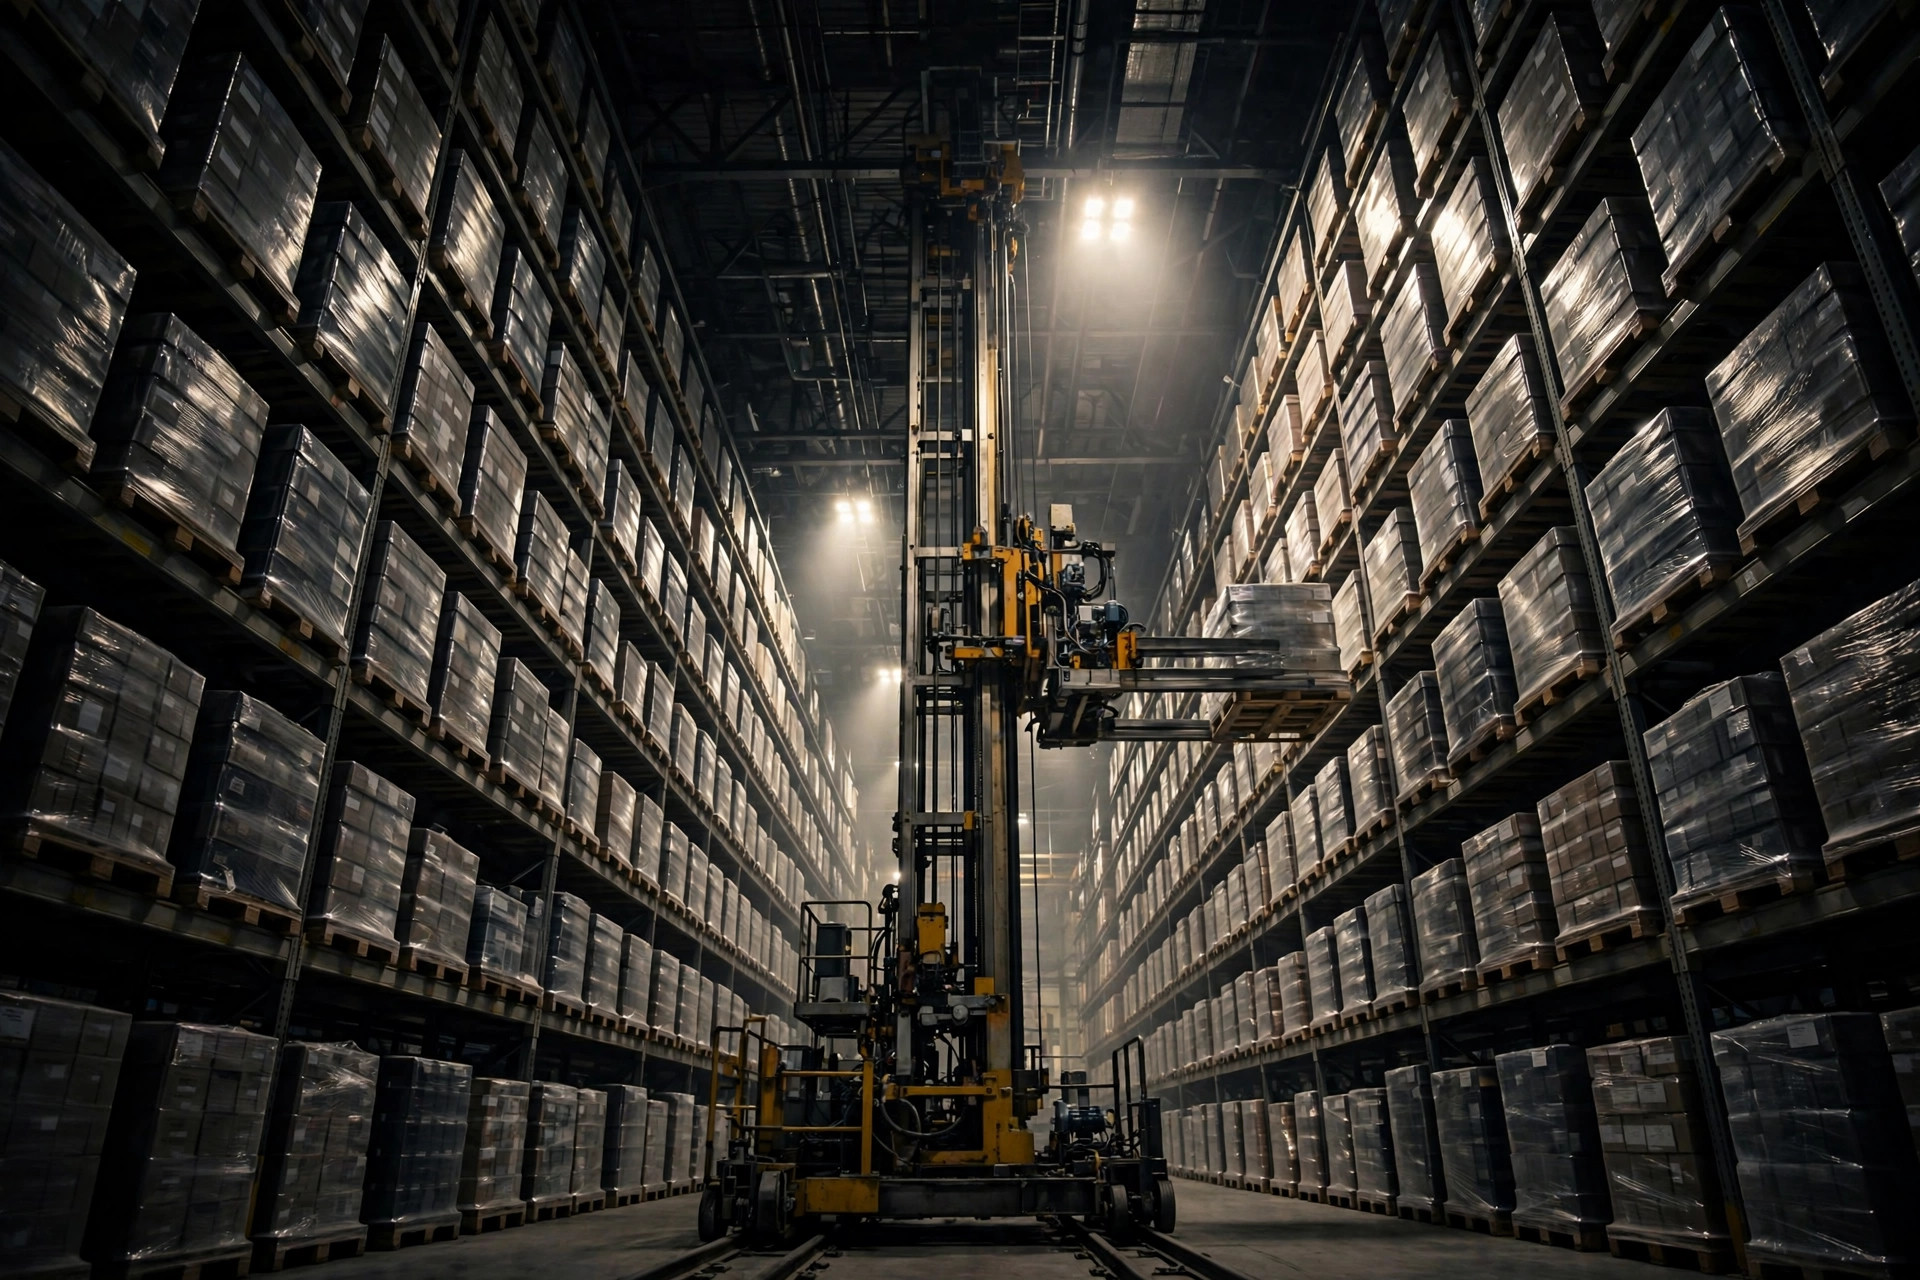
The ROI Report the Board Sent Back
Three years ago, a client took an AS/RS project to the board. The CFO asked three questions: "What wage inflation did you assume? Did you deduct vacancy periods from the rent savings? How many spare-parts cycles over 10 years?" The project manager couldn't answer. A $12M project died on the spot. Six months later we rebuilt the model — five variables, each backed by data. The CFO's verdict: "I can't poke holes in this one." Unanimous approval.
Automated storage (AS/RS) routinely costs $5M–$20M, and ROI modeling isn't finance filling in a template — it's a precision model of five variables. Get one variable wrong and the payback conclusion swings by years.
Five Variables, Modeled One by One
Variable 1: Labor — The Biggest Line, Calculated Dynamically
An AS/RS replaces forklift drivers, pickers, and counters — typically 20–40 people for a 10,000-pallet system. The key: US warehouse wages inflate 4–6% annually; the model must run 10 years dynamically, never today's wage × 10.
| Year | Salary/Person | Annual Savings (30 people) | Cumulative | |---|---|---|---| | Year 1 | $42,000 | $1.26M | $1.26M | | Year 3 | $47,000 | $1.41M | $4.05M | | Year 5 | $52,700 | $1.58M | $7.10M | | Year 10 | $67,000 | $2.01M | $16.20M |
Static math says $12.6M over 10 years; dynamic says $16.2M — a $3.6M difference. That's the CFO's first question.
Variable 2: Land/Rent Savings — The Quiet Giant
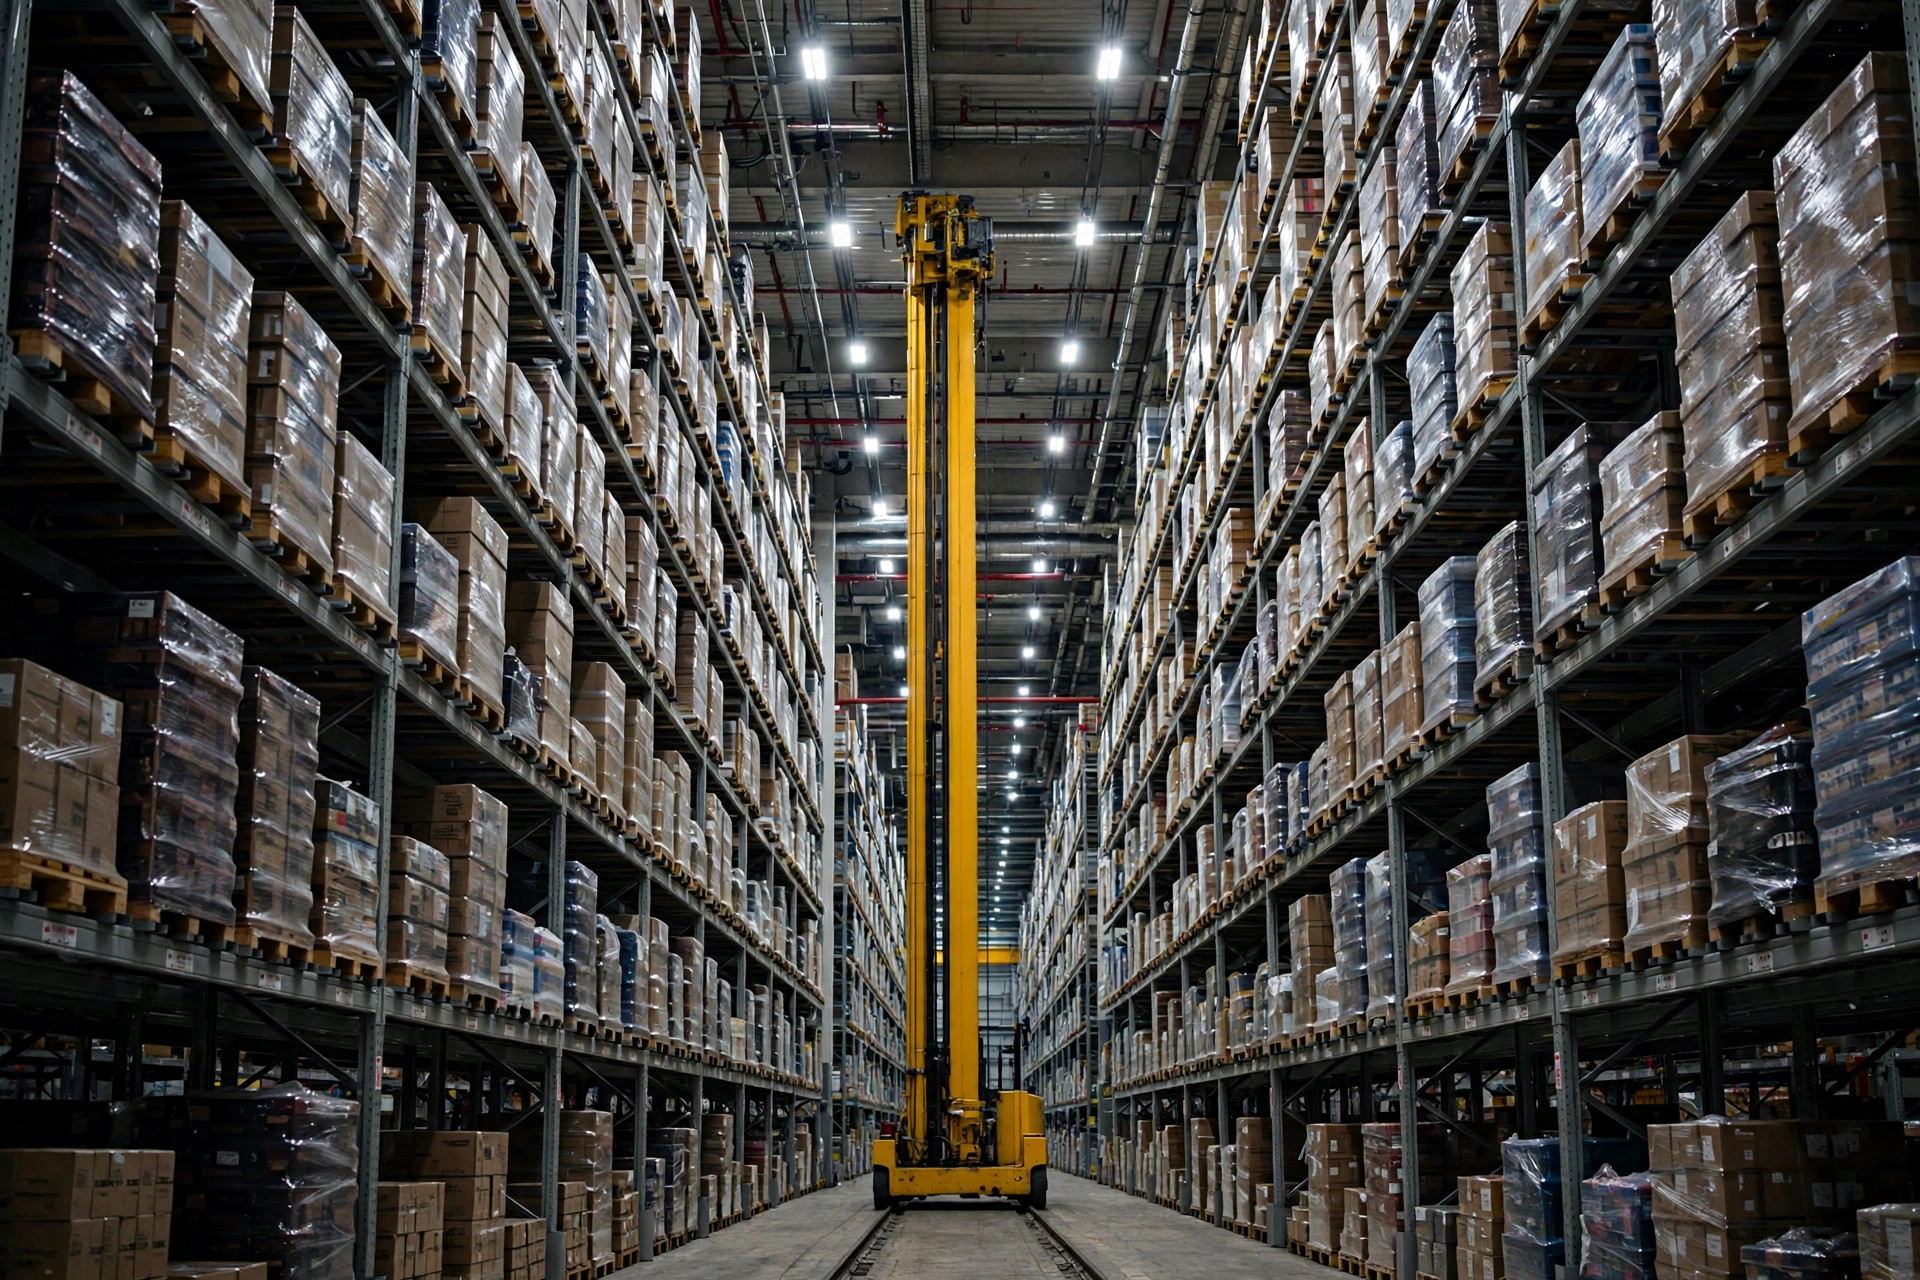
Raising storage from 6 m to 24 m cuts footprint 60–70%. Two ways to count it:
- Greenfield: compare total land + construction for "flat warehouse" vs. "AS/RS" designs — the delta is the savings. A 12,000-pallet project needs 20,000 m² flat but only 6,000 m² with AS/RS — $4–6M in land and construction delta.
- Existing site: freed space gets subleased or absorbs growth — local rent × area × 10 years. At $10–14/m²/year on the US West Coast, 5,000 freed m² is $5–7M over a decade.
Deduct vacancy: freed space doesn't lease on day one — haircut 6–12 months of vacancy. That's the CFO's second question.
Variable 3: Throughput Gains — The Velocity Money
An AS/RS runs 24/7 at 2–3x manual forklift throughput. The money shows up twice:
- Order cycle time: dock-to-stock or order-to-ship compressed from 4 hours to 1 — e-commerce client retention improves; value it via reduced churn.
- Peak without hiring: manual warehouses need 3x temps at peak; an AS/RS just runs longer hours. Temp premiums run 30–50%; two peak months a year adds up fast.
Quantify it: peak labor delta = (peak headcount − base headcount) × temp premium × peak months. A warehouse at 200 base / 500 peak saves $1–1.5M/year here alone.
Variable 4: Error & Shrink Reduction — Never Dismiss 1%
Manual warehouses run 97–98% inventory accuracy; AS/RS hits 99.9%. That 1–2 point gap, in dollars:
- Count variances: on $200M annual throughput, 1% variance is $2M.
- Damage: forklift impacts cause 0.3–0.5% annual damage — near zero with AS/RS.
- Expiry write-offs (food/pharma): system-enforced FIFO cuts waste 30–50%.
This routinely saves $1–3M/year — yet it's the most commonly omitted line in ROI models, because the money is scattered across departments' books.
Variable 5: TCO — 10 Years, Not 1
The CFO's third question: how many spare-parts cycles over the equipment's life? AS/RS TCO includes:
- Initial investment (equipment + civil + software + integration)
- Annual maintenance: 3–5% of equipment cost/year
- Major overhauls: stacker cranes need one at ~10 years; shuttle carts batch-replace every 5–8 years
- Software upgrades: WCS/WMS interface refreshes every 3–5 years
- Energy: 24/7 operation means six-figure annual power bills
| Cost Item | 10-Year Amount (example) | Share | |---|---|---| | Initial investment | $12.0M | 68% | | Annual maintenance (4%/yr) | $4.8M | 27% | | Major spares/overhauls | $1.5M | 8% | | Software upgrades | $0.8M | 5% | | Energy | $1.2M | 7% | | 10-year TCO | ~$20.3M | 100% |
Payback = initial investment ÷ (annual benefit − annual operating cost), where annual benefit sums variables 1–4 and operating cost comes from variable 5.
Real Case: The $12M Project That Passed the Board
Back to the opening story: 12,000-pallet stacker-crane AS/RS, $12M initial investment. The five variables:
- Labor: 35 people replaced, ~$18.9M dynamically over 10 years
- Rent: 8,000 m² freed, vacancy-adjusted, ~$9M over 10 years
- Throughput: peak-labor savings + faster fulfillment, ~$1.2M/year
- Errors: accuracy gains + damage reduction, ~$1.8M/year
- TCO: ~$20.3M over 10 years
Annual benefit = 1.89 + 0.90 + 1.20 + 1.80 = $5.79M (labor annualized); annual opex ~$0.8M. Payback = 12 ÷ (5.79 − 0.80) ≈ 2.4 years. The CFO couldn't poke holes; unanimous approval. Two years post-launch, actual payback is tracking 3 months ahead of model — wage inflation overshot assumptions.
We also gave the board a sensitivity analysis: wage inflation at 3% (pessimistic), 5% (base), 7% (optimistic) → paybacks of 3.1, 2.4, and 1.9 years. All scenarios under 4 years means the project can't mathematically fail. Always bring sensitivity analysis — it doesn't prove your precision; it proves there's no scenario where you lose money. That's what lets a board sleep at night.
Pitfalls: Four Modeling Traps
- Static wages over 10 years: missing 4–6% annual inflation understates benefit 30% — good projects get wrongly killed.
- Full occupancy on freed space: 6–12 months of vacancy is normal; un-haircut rent is phantom benefit.
- Ignoring TCO: capex-only payback looks short; then operations blow the budget every year after go-live.
- Double-counting: throughput gains and labor savings overlap (peak headcount) — de-duplicate, or the CFO spots it instantly.
Summary
An AS/RS ROI model's five variables — labor (with inflation), rent (minus vacancy), throughput (peak value), errors (the expensive 1%), TCO (the 10-year ledger) — each need a data source and defensible logic that survives the CFO's three questions. Remember: boards don't fear expensive projects; they fear sloppy models. Build it rigorously, and a $12M project passes unanimously.